|
Index of this page
Equipment used
- Minolta Dynax 7 (analog version)
- Sony Alpha 900
- Minolta 50mm 1.7 prime / standard lens
- Manfrotto 190B tripod with 141RC head
- Minolta remote release
- Minolta 5600Xi and Minolta 5600HS flashes & umbrellas
- Imacon Flextight 848 scanner
Films used
- Kodak Ektar 100 (Color negative)
- Kodak Portra 160VC (Color negative)
- Kodak TMax 100 (B&W negative)
- Fuji Velvia 100 (Color positive / slide - RVP100 emulsion)
Equipment and film choice
Why the choice for this equipment? Well, mainly for
practical reasons. My Minolta Dynax 7 has been a long time companion
and the 1.7 prime lens has given excellent results in the past.
Being virtually distortion free and a fixed focal length prime lens,
this lens is ideal for such a test where quality of the lens is
of utmost importance. In addition, the 1.7 maximum aperture allowed
for a bright viewfinder and accurate focusing. For a decent review
of this particular lens, see this reference: Minolta
AF 50 mm f/1.7- Legacy test report. As for the choice of films,
these were the films I had in stock at (about) 100 ISO, and it is
only useful to compare films at roughly the same ISO.
Lastly, the scanner choice is the only practical option
too. I realize that some of you might argue it might have been better
to use a drum scanner and it's sophisticated options for "hiding"
grain and it's superior dynamic range, even compared to the high
end quality of the Imacon. However, having film drum scanned is
both expensive, and a not very common service here in the Netherlands,
whereas I can simply hire the Imacon scanners for a very reasonable
price per hour at the same professional lab that develops my color
film. Having these images drum scanned would probably have cost
me 10 times the amount of money...
To show you the difference between a professional scanner
and a consumer grade combined flatbed / filmscanner, I hereby include
an 4800 ppi scan of my consumer grade Canon 9950F. Although Canon
boasts this scanner to have "4800 ppi" resolution (ppi
= Pixels-Per-Inch, so the number of pixel
rows or columns a scanner or digital camera captures per inch),
in my experience it doesn't do more than an actual optical resolution
of 1200 ppi, good enough for large format 4x5 inch photography,
but not 35mm. Above that value, it just adds blurry redundant pixels,
that do not add to the actual image detail.
To show this last aspect, I have also made scans at
1200 and 2400 ppi that are subsequently upscaled in Photoshop to
4800 ppi using a bicubic interpolation. The small insets in the
1200 and 2400 ppi upscaled scan samples represent "actual pixels"
or 100% viewing crops of the original 1200 and 2400 ppi scans. As
you can see from these images of the 9950F, the straight 4800 ppi
scan doesn't look any better than any of the upscaled versions,
even compared to the low resolution 1200 ppi scan, meaning the actual
optical resolution of this scanner is no more than a measly 1200
ppi... Do notice though, that at 1200 ppi, the "actual pixels"
inset looks pretty good and reasonably sharp, the reason why I still
consider this scanner suitable for large format scans. Even a low
1200 ppi scan of a 4x5 inch negative results in a 4800 x 6000 pixel
image size, so an almost 30 Mpixels scan...
To make a fair and clear comparison with the Imacon
scans, I downscaled the Imacon scan from 8000 to 4800 ppi.
This loses some detail, but as you can see, the Imacon still beats
the Canon 9950F by far!
And yes, the difference is REALLY that big and
shocking!!! All Canon 9950F scans, as with the Imacon, without sharpening
applied. All sample images in this comparison from Fuji Velvia 100.
And now some of the pure digital folks are going to
argue that the left Imacon image still looks crap in terms of sharpness
and detail compared to their 6 Mpixel digital shots. Well, you have
to remember:
- This image is completely unsharpened and more or
less equivalent to a RAW output digital shot, whereas JPEG output
on a digital camera usually constitutes full in-camera sharpening
- At 4800 ppi, you are looking at a tiny crop of a
roughly 4400 x 6400 pixel image (28 Mpixel). At this detail level
of scanning, we are stretching 100 ISO film to it's absolute limits
and start to reveal the grain or dye clouds that form the image.
The dye clouds of a color negative or slide are inherently a bit
fuzzy, and will never produce the clean signal of a sensor's pixel.
|
Imacon Flextight 848
8000 ppi scan downscaled to 4800 ppi, bicubic
interpolation
|
Canon 9950F
4800 ppi straight
|
Canon 9950F
1200 ppi scan upscaled to 4800 ppi, bicubic interpolation
|
Canon 9950F
2400 ppi scan upscaled to 4800 ppi, bicubic interpolation
|
 |
|
|
|
If you want to know more about Imacon scanners and their
sophisticated design including the autofocusing mechanism, visit
the Hasselblad website and read the following good review by Giorgio
Trucco: Imacon
Flextight 949, A review of the grapes, as the fox sees them!
A note to Sony Alpha users:
Since I do not own a Sony Alpha 900 yet (nor have
the money for it at the moment), and just got to the opportunity
to shoot a few test shots with it in far from ideal conditions,
I must beforehand apologize for the appalling quality of the flash
exposure in this image. I made this photo in the "passport-photo"
corner of a (camera-)shop. The test chart was hung on the wall where
normally a person would sit, the test chart oriented vertically,
with a softbox to the right, and studioflash with umbrella to the
left. Unfortunately, both of the flashes were bolted to the ceiling
in such a way that I had no possibility to re-position them, resulting
in a very uneven flash exposure and severe reflections in part of
the image. Sorry for this, I was just glad to be able to shoot with
it for comparison. Luckily, the most important part of the chart
(the center) was largely spared from reflections and still usable.
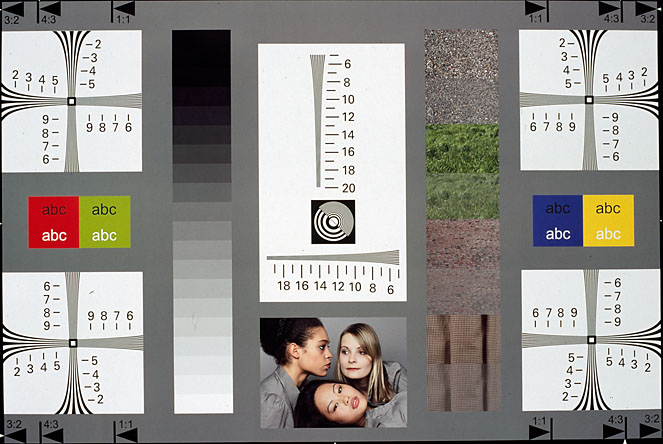
Test chart description
The test chart has been created by a German company
called IE
Image Engineering and features a 60x90 cm large test chart image
containing both resolution test lines and a few pictures. The small
pictures to the right of the center are repeated both in low and
normal contrast for evaluation of (low) contrast rendition of digital
sensors. The numbers denoted on the chart represent lines-per-picture-height,
where height is the short site of the image, so in case of a regular
35mm negative or full frame digital camera, it's 24mm. Actually,
the number on the chart should be multiplied by a factor of 100,
so "20" is 2000 lines per 24 mm. In my
definition of line pairs, this is equivalent to 1000 line-pairs
per picture height, as IE counts both black and white lines.
|
IE Image Engineering test chart (actual size of
test chart area 60x90 cm) , Fuji Velvia 100
|
|
Shooting setup
|
- The camera was setup straight in front of the
test chart on the tripod with cable remote release
- All exposures with a minimum 2 second mirror
lock-up before the actual exposure to avoid camera shake completely
- The camera was setup straight in front of the
test chart, test chart oriented "vertically", meaning
longest site of test chart vertical. This was done for convenience
reasons, due to limited space and size of test chart it was
easier to setup this way. Of course, a 90 degrees CCW rotation
is easily done afterwards in any photo editor.
- Flashes to the left and right of test chart,
a Minolta Spotmeter F was used to check equal exposure across
the test chart (see my remark above to the Alpha users about
the Alpha 900 shot and poor flash exposure), a slight hotspot
remained in the center of the image, as is visible in the
scans.
- Films were exposed at the manufacturer specified
boxspeed, and developed accordingly, so 100 ISO far all films,
except Kodak Portra 160VC.
- To be absolutely sure of having a correct exposure,
1/3 of a stop flash bracketing was applied, from -1 to +1
stop of grey card measured exposure. The inclusion of the
Velvia slide film also helped in evaluating proper exposure
and decide which images to scan.
- Aperture set: F5.6 for optimal lens performance.
Due to the fixed setup in the passport corner, the Sony Alpha
900 shot at F9.0
- Color films were developed at a professional
lab here in the Netherlands that I have good experiences with
- The B&W Kodak TMax 100 film was developed
by myself, per Kodak instructions, 6 1/2 minutes in stock
solution strength D76 at 20 degrees C. Agitation per my own
cycle, close to recommended.
- Flextight settings:
- 16bit / channel (RGB 48bit) scanning for maximum
fidelity in capturing pixel values and maximized options
for color correction in Photoshop.
- All sharpening turned of (amount set at -200,
"Apply" checked of)
- Noise filter turned of
- All other image enhancement features turned
of, except of course the choice of color profile / film
type in case of the Kodak Portra 160VC and Ektar 100 scans.
Since there was no profile available for Ektar 100, this
film was scanned with the Portra 160VC profile as well,
as both films boast high saturation, and the overall "look"
of the color negatives appeared quite similar.
- Sony Alpha 900 settings:
- Quality: ExtraFine JPEG (XFine)
- Resolution: 24 Mpixel (4032x6048 pixels exact)
- Colorspace: AdobeRGB
- Colorsaturation: Standard
- ISO: 100
I realize it might have been better to shoot RAW
and to use the Sony delivered RAW converter for maximum quality
conversion to for example 16bit TIFF or PSD, however, as remarked
before, I don't own the Alpha 900 and do not have the necessary
software to process the files. The XFine JPEG setting is thus
the second best option. Shooting at 100 ISO also ensured getting
maximum quality of the Alpha 900, as it is well known that
many digital camera perform less at high ISO ratings.
|
Sharpening digital images and presentation in this test
Please note that almost all of the images presented
in this test represent 100% images ("Actual pixels" in
Adobe Photoshop), unless otherwise stated, so each captured pixel
is truly visible. Some of the images have been sharpened, others
not, besides maybe a very modest default amount of sharpening applied
by the scanner or camera outside the control of the operator. All
images have been converted to the sRGB colorspace for proper display
of digital images in webpages.
For those people less familiar with digital images and
processing, I hereby include some samples of an image sharpened
to different amounts, to show you the effect of what sharpening
does with a digital image. Most scanned photos or photos made with
a digital camera, actually need a bit of sharpening. Sharpening
enhances edge contrast, thereby making an image appear sharper.
However, it should generally be applied with caution, as it can
ruin an image if improperly applied. For professional digital cameras
like digital reflexes, manufacturers often choose to keep in-camera
sharpening to a minimum, so as to leave the amount of sharpening
up to the photographers choice. The Alpha 900 does appear to do
a moderate amount of sharpening though in it's JPEG output. The
Imacon Flextight scanner can be tweaked to skip sharpening fully.
The high resolution scans and images generated by the Imacon and
the Alpha 900 actually leave little room for sharpening. Looking
at the results, I am pretty much convinced that for most printing
applications, whether a true press type application like a photo
in a glossy magazine, or printing a single photo on a professional
photo printer, additional sharpening could be left out of the equation
altogether for the Alpha 900, whereas only a moderate amount of
sharpening would be required for the Imacon scans, as the large
images created by both sources already contain huge amounts of detail
that will print fine on most regular print sizes.
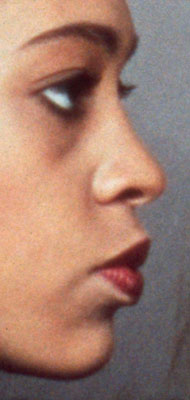
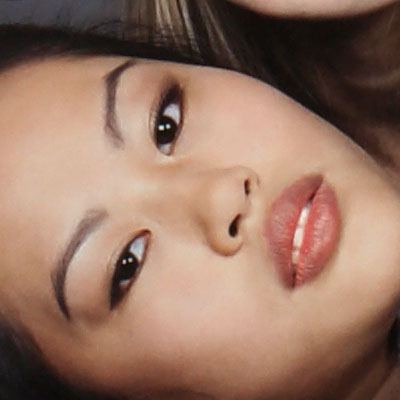
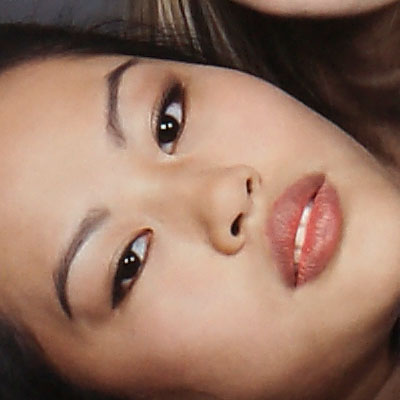
However, as you can see from the image crops below from
the Imacon film scans and the Alpha 900, a certain amount of sharpening
does make the eyes "pop" and stand out more. I should
note though, that a low radius is an absolute necessity, as even
the slightest increase starts ruining the image. There is that much
detail captured by the Imacon and Alpha 900 with proper focusing...
Actually, the Fuji Velvia 100 scan is on the brink of being oversharpened
at a sharpening amount of 200%, but although the left unsharpened
image may look more pleasing in terms of "smoothness",
the right image that starts to show the grain, does reveal more
detail, for example in the lips. And the grain "specks"
visible in the sharpened image are not just "artifacts"
of the sharpening process, but are actually visible in the left
image as well, if you look carefully.
|
Unsharpened Fuji Velvia 100
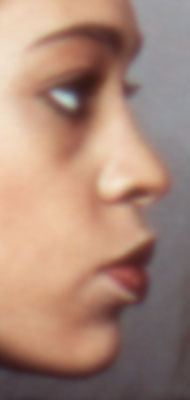
|
Sharpened Fuji Velvia 100
Unsharp Mask Photoshop settings:
- Amount: 200%
- Radius: 0.7
- Threshold: 2
|

|
 |
|
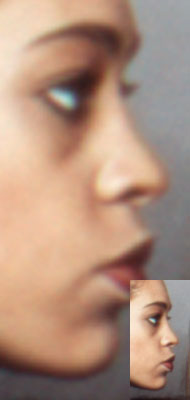
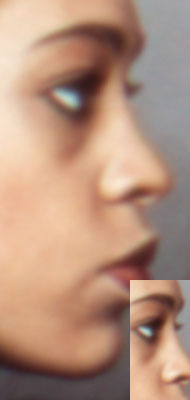
Unsharpened image Alpha 900
|
Sharpened image Alpha 900
Unsharp Mask Photoshop settings:
- Amount: 80%
- Radius: 1
- Threshold: 2
Notice the first signs of sharpening artifacts
at the cheeks rim, even with this modest level of sharpening |
 |
 |
The definition of a "line pair" and resolution
testing
There is lots of discussion about resolution testing
of lens / film or lens / digital sensor combos. Unfortunately
though, many authors fail to acknowledge the need to define the
actual scale at which the resolution is being measured. A common
measure is "line-pairs-per-millimeter"
where millimeter is a millimeter of the film negative's width or
height, or similar for the digital sensor in a digital camera. The
value that is assigned to this measure usually defines the maximum
number of line pairs that can be distinguished when looking at a
print or digital image. It is usually tested by photographing a
test chart containing a set of closely spaced black and white lines,
often in the form of a set of slowly converging lines as in the
test chart used in this test, but regular spaced patterns are also
common.
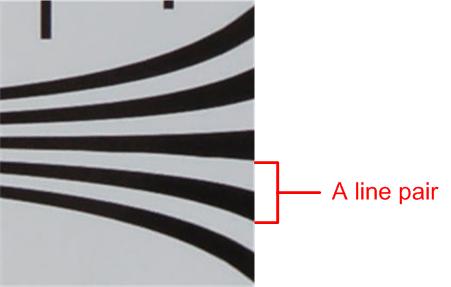
Now, what is a "line pair"? In this test,
I assume a line pair is a combination of one black
and one white line, as in the figure below:
| Line pair definition |
 |
Now, while this maybe rather obvious, and the definition
of a line pair not to ambiguous, things start to become a little
bit more confusing when talking about a scale like "lines-per-millimeter",
as opposed to "line-pairs-per-millimeter"...
because, which lines do we count? Only the white or black lines,
or both? If we just count the black lines, the number
will be the same as in my definition of a "line pair",
however, when counting both black and white lines,
the figure will be double that. This ambiguity and the failure to
define the scale at which resolution is measured, gives rise to
a whole bunch of misconceptions and misunderstandings about resolution
measurements of lenses, and lens / film, or lens / digital sensor
combinations.
Worse though, some authors that abbreviate the scale
(like "lpmm" for "lines-per-millimeter" or "lppmm"
for "line-pairs-per-millimeter) even manage to intermingle
these measures in one and the same article, often due to typing
errors, adding to the confusion. So you might find "50 lpmm",
"50 lppmm" and "50 lp/mm" in one and the same
article referring to the same resolution figure. And even worse,
typing errors like "lpppm" and "lpmmm" are common
too...
Now you tell me what the actual resolution figure must
be in such an article!
Back to my definition: I use "line-pairs-per-millimeter"
and I will (at least try!!) to consequently abbreviate this as "lp/mm"
|