|
Previous:
Analysis of grain structure< > Next:
Per channel scan performance
Index of this page
Evaluation of resolution / resolving
power and focus
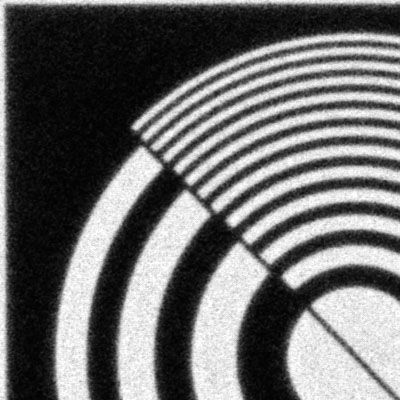
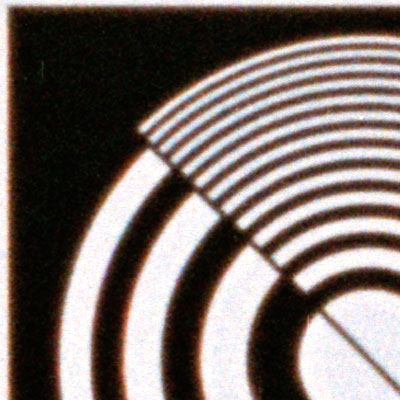
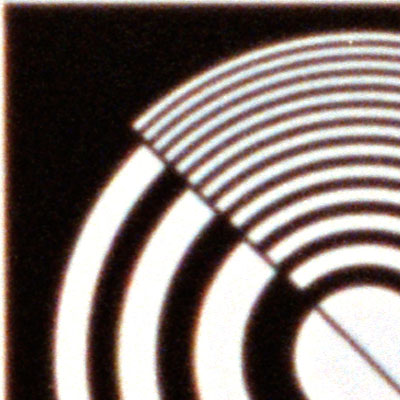
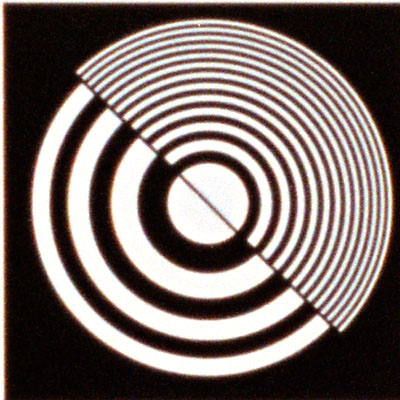
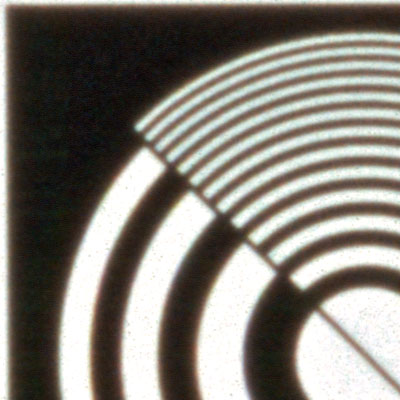
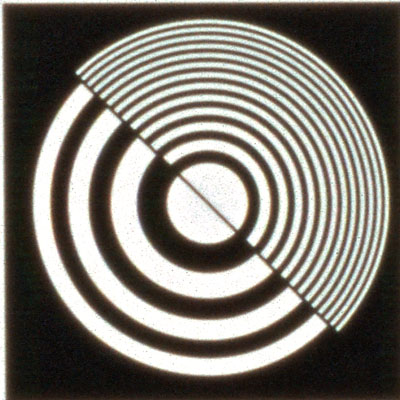
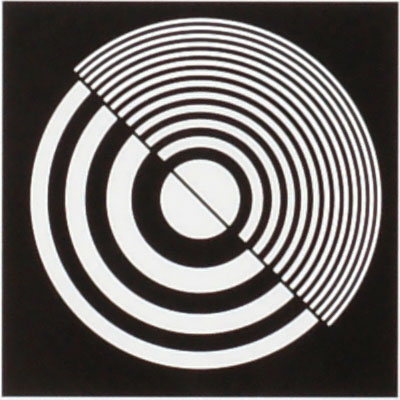
The images below are crops of the full 8000 ppi resolution
scans. As can be seen from these images, I think I got the focus
of the chart spot on. The scans may look a bit soft, but remember:
they are unsharpened and at "actual pixels" level, you
are looking at a significant enlargement compared to the original
test chart (see topic discussed here).
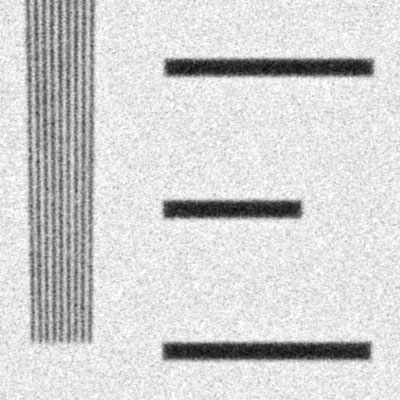
In addition, they are a bit "over-scanned", a 4000 ppi
scanning resolution would have been more realistic in terms of matching
true captured film detail and the Alpha 900. I have therefor also
included downscaled samples at 4525 ppi. At that resolution, these
samples closely match the Alpha 900's image size. These last samples
have received a bit of sharpening as well after the downscaling.
The reason why the original 8000 ppi scans appear "bigger"
than the Alpha 900 shot, is because they ARE bigger. At 8000 ppi,
these images are about 7100x10500 pixels (depending on exact scanned
film area), so approximately 75Mpixel, triple the amount of the
Alpha 900. Also notice the incredibly "clean", I would
be tempted to say almost sterile, look of the Alpha 900 shot. At
100 ISO, pixel noise is pretty much absent in this digital shot,
something that can not be said of higher ISO shots with this camera,
according to some of the first reviews I have seen of the Alpha
900.
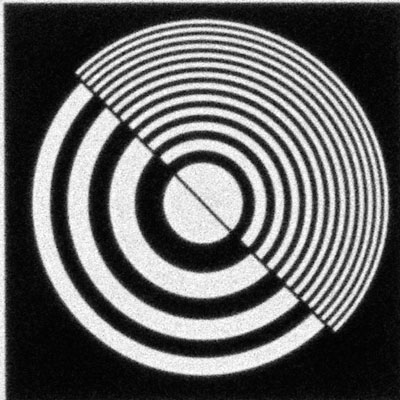
Notice that, contrary to the first public release of
this test using a poorly calibrated Imacon 646 scanner, the new
scan results clearly show that all films are easily capable of reaching
the 2000 lines-per-picture-height mark, which translates to about
43 lp/mm. Since this is the highest resolution line pattern on this
particular chart, all films and the Alpha 900 therefor outresolve
the chart. In hindsight, it would have been better to a use a chart
containing higher resolution line patterns, preferably up to at
least 100 lp/mm. Still, the included photo samples on the chart
do give some insight in the true resolving power of all the films
and the Alpha 900. Read on for that!
|
Kodak TMax 100, 8000 ppi
|
Kodak TMax 100, 8000 ppi
|
 |
 |
|
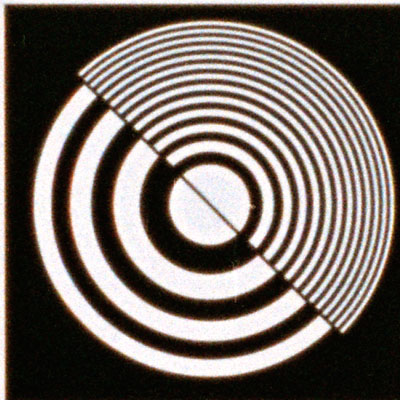
Kodak TMax 100, 4525 ppi
to match Alpha 900
|
Kodak TMax 100, 4525 ppi
to match Alpha 900
|
 |
 |
|
Kodak Portra 160VC
|
Kodak Portra 160VC
|
 |
 |
|
Kodak Portra 160VC
|
Kodak Portra 160VC
|
 |
 |
|
Kodak Ektar 100
|
Kodak Ektar 100
|
 |
 |
|
Kodak Ektar 100
|
Kodak Ektar 100
|
 |
 |
|
Fuji Velvia 100
|
Fuji Velvia 100
|
 |
 |
|
Fuji Velvia 100
|
Fuji Velvia 100
|
 |
 |
|
Alpha 900
|
Alpha 900
|
 |
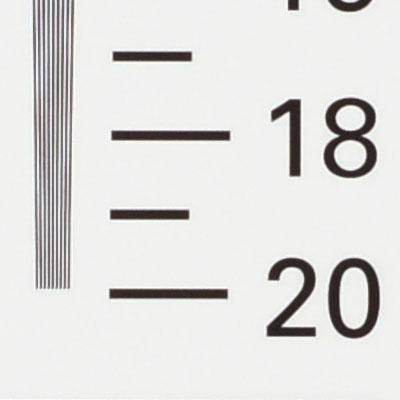 |
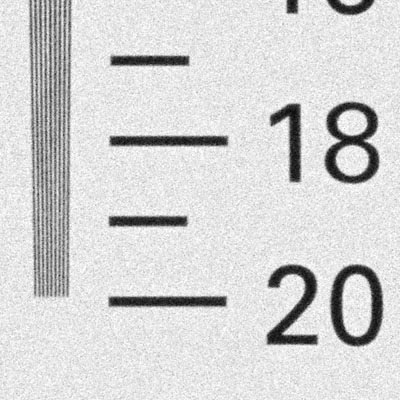
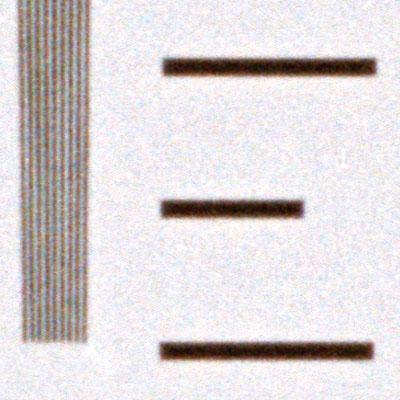
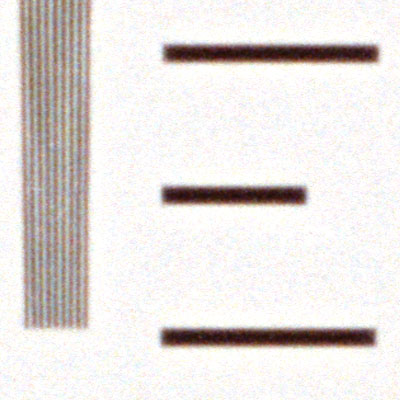
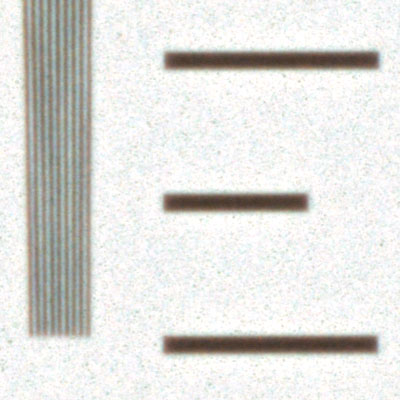
Now viewing images at "actual pixels" tells already a
lot, but not the whole story. By enlarging the line patterns to
800% in Photoshop, we are able to see the individual pixels. In
the images below, you can see the end of the vertical line pattern
that represents the 2000 lines-per-picture-height resolution.
This resolution translates to about 40 lp/mm. Note that there are
two series of images, the first ones represent the full 8000 ppi
resolution samples, the second series the downsized images that
match the Alpha 900's resolution.
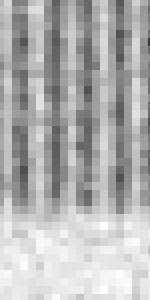
Now the first thing you should notice is that, what appeared to
be pretty solid black lines in all of the above shown pictures,
turn out to be rather low contrast pixelated line and grain patterns
in reality! Our human eyes, and the human brain, deceive us when
looking at the "actual pixels" 100% images, and translate
the repeating pattern of darker and lighter areas in a pretty solid
"white / black" transition. Contrary to the first public
release of this test with scan results of a badly calibrated "backup"
Imacon 646 scanner, that wasn't capable of showing that the color
negatives films in this test resolve the 40 lp/mm highest resolution
line pattern on the test chart, the new scans of the overhauled
Imacon 848 do show that all films are capable of resolving
the 40 lp/mm line pattern with ease.
Lastly, notice the extremely clean image of the Alpha 900, clearly
there is definition and contrast enough left for even higher resolution
figures. The Alpha 900 gets very close to it's theoretical limit
in combination with this lens. If we consider that it has a sensor
of 4032 x 6048 pixels, and if each pixel row actually counted, than
the maximum resolving power of the sensor would be (4032 / 2) /
24 mm = 84 lp/mm. With 40lp/mm guaranteed and room left for resolving
additional image detail, that's not bad!
|
Kodak TMax 100
|
Kodak Portra 160VC
|
Kodak Ektar 100
|
Fuji Velvia 100
|
Sony Alpha 900
|

|

|

|

|

|
Downsized images that match the Alpha 900's resolution:
|
Kodak TMax 100
|
Kodak Portra 160VC
|
Kodak Ektar 100
|
Fuji Velvia 100
|
Sony Alpha 900
|
|

|

|

|
|
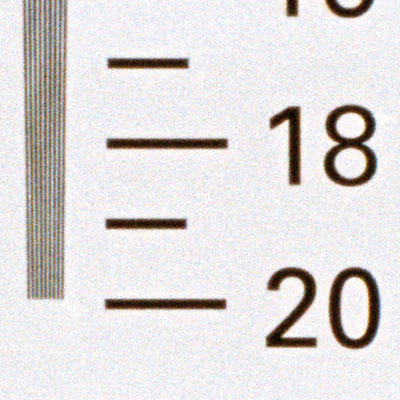
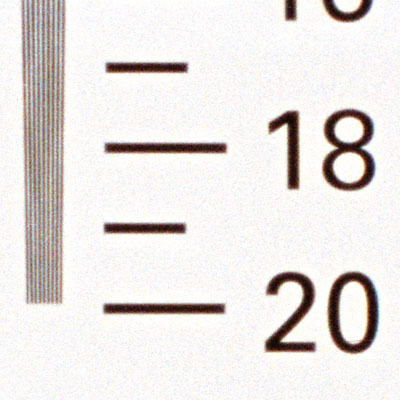
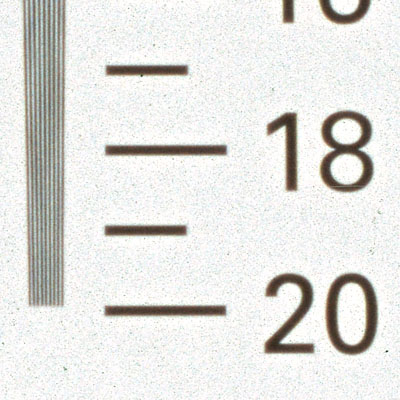
However, to put these 800% images in a more realistic
context, I show you a 1200 ppi direct flatbed scan of the original
test chart. So this is NOT a scan of a negative or slide, but a
direct scan of the test chart itself! As you can clearly see from
this image, the lines that were being photographed in these shots,
aren't perfectly hard edged either in reality. In fact, you can
see the offset printing pattern deteriorating the line definition.
Be aware though, that although you might be fooled by this giant
enlargement into thinking the print quality of this test chart was
particularly bad, it actually looks sharp and perfectly normal in
reality.
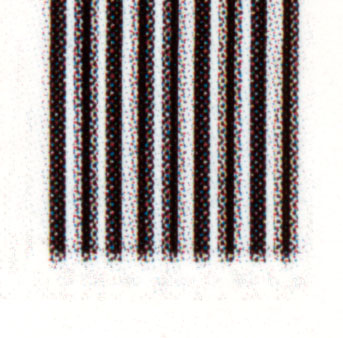 |
Canon 9950F direct scan of test chart
Notice the offset printing screen pattern being
visible in this image, and the overall "fuzziness"
of the lines themselves as a consequence of this. Please notice
that the actual real world size of this printing / line pattern
is no more than just about 5 mm wide!
|
Previous:
Analysis of grain structure< > Next:
Per channel scan performance
|